Uncovering Production Decline Characteristics of Oil Wells
-
Petroleum and natural gas remain the most-consumed sources of energy in the United States through 2050, this energy demand requires to be replenished since oil rates decline with time due to the natural loss of reservoir pressure.
-
The most common form of visualization to understand oil and gas production is a rate vs. time plot. It is common to average the rates of hundreds of wells to evaluate the performance of a single or group of wells against a benchmark in a particular.
-
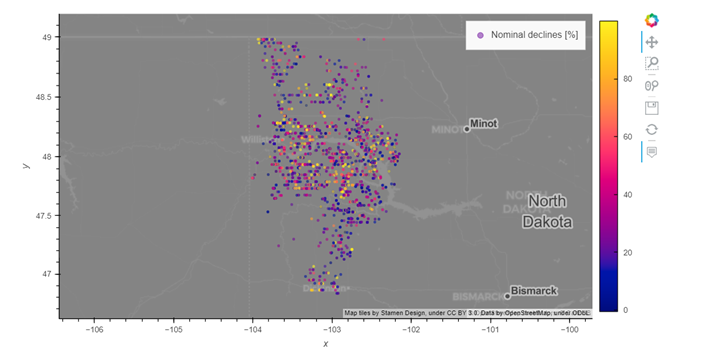
However, well location is a key factor in determining productivity, the combination of spatial-temporal dynamics represents a challenge to understand key factors and leverage those findings to improve well productivity.
-
We explore a dataset of almost 8000 oil wells, apply an automated decline curve methodology (DCA) to extract important characteristics from each well, and then present our findings in an interactive dashboard where the combination of decline values and well location allows the user to identify areas of higher productivity.
check the full project on my repo